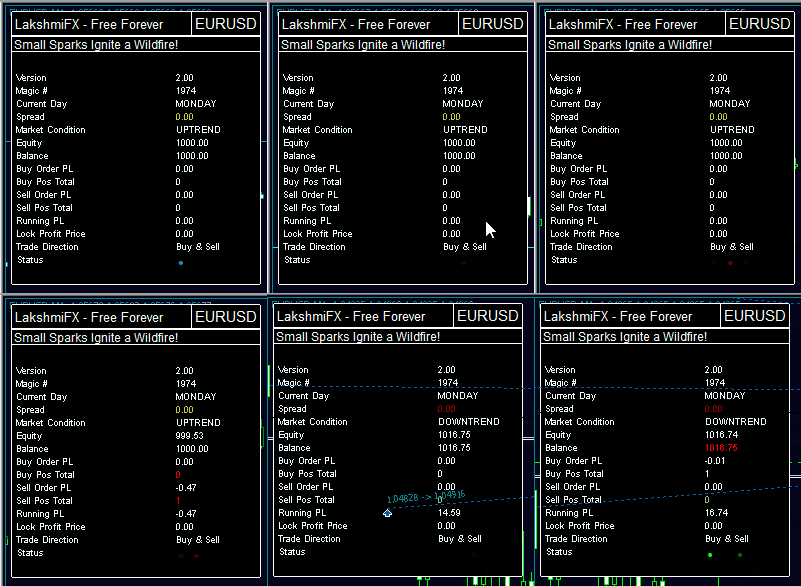
The LakshmiFX Expert Advisor (EA) isn’t just a tool—it’s a partner in your trading journey. To make its actions crystal clear and engaging, we’ve integrated the LfxStatusAnimation class into its framework. This clever visual system uses a “Dot-Flashing” animation to keep you in the loop, displaying the EA’s status right on your chart with intuitive, colorful dots. Whether LakshmiFX is actively hunting for trade opportunities or patiently monitoring the market, these animations offer a quick, glanceable way to understand what’s happening behind the scenes. Here’s how it works and why you’ll love it.

Trade Analysis Mode: Scanning with Purpose
When LakshmiFX shifts into gear to find trading opportunities, the DrawGrokThinking function lights up your chart with a dynamic display of three dots. These aren’t just any dots—they’re a mini light show with a mission:
- What You See: The three dots blink in sequence from left to right, one disappearing at a time every 200 milliseconds, creating a smooth, flowing pattern that repeats every 600 milliseconds. It’s like a tiny scanner sweeping across your screen, symbolizing the EA’s active search for the perfect trade.
- Color Coding:
- Green Gradient (Lime Green, Green, Dark Green): When LakshmiFX is on the hunt for a Buy signal, the dots glow in vibrant shades of green. This gradient—from bright lime to deep forest—evokes growth, opportunity, and upward momentum, mirroring the bullish intent.
- Red Gradient (Red, Dark Red, Maroon): If it’s a Sell signal the EA is after, the dots shift to a striking red palette. The progression from bold red to a deeper maroon hints at caution and downward pressure, aligning with bearish market analysis.
- Why It’s Meaningful: The sequential blinking isn’t just eye-catching—it’s purposeful. It suggests progress, as if LakshmiFX is methodically evaluating market conditions step-by-step to pinpoint the right moment to act. This lively animation reassures you that your EA is working hard, leaving no stone unturned in its quest for a profitable trade.
Imagine it as your EA’s heartbeat during analysis—steady, rhythmic, and full of intent. The dots appear instantly when trade analysis begins, all sized at a subtle 12 pixels, ensuring they’re noticeable without overwhelming your chart.
Monitoring Mode: A Watchful Eye on the Market
When LakshmiFX isn’t actively seeking trades, it doesn’t just sit idle—it keeps a vigilant watch on the market. The DrawThreeDots function brings this monitoring phase to life with a different take on the “Dot-Flashing” animation:
- What You See: Three dots appear one by one with each new tick (price update), building a small trio across your chart. Once a dot arrives, it blinks for a moment before settling into place:
- First Tick (Bright Blue): The first dot blinks every 200 milliseconds, signaling the EA’s initial response to market activity.
- Second Tick (Vibrant Purple): The second dot joins in, blinking while the first stays steady, showing the EA is still alert and tracking.
- Third Tick (Bright Green): The third dot blinks, with the first two now solid, completing the set. After this, the trio vanishes, and the cycle restarts with the next tick.
- Color Coding:
- Bright Blue: A crisp, cool hue for the first dot, suggesting calmness and readiness.
- Vibrant Purple: A rich, lively shade for the second, hinting at the EA’s growing awareness.
- Bright Green: A fresh, optimistic green for the third, tying it all together with a sense of continuity.
- Why It’s Meaningful: This per-tick blinking ties the animation directly to market activity, giving you a visual pulse of the EA’s attentiveness. Each blink is like a nod from LakshmiFX, saying, “I’m here, I’m watching.” The reset after three ticks keeps the display clean and dynamic, avoiding clutter while reinforcing that the EA is always ready to jump back into action.
Sized at 12 pixels, these dots are subtle yet distinct, blending seamlessly into your chart without stealing focus from price action.
Why You’ll Appreciate It
The LfxStatusAnimation class isn’t just about aesthetics—it’s about clarity and connection. Here’s what makes it special:
- Instant Insight: No need to dig through logs or guess what LakshmiFX is doing. A quick glance at the dots tells you whether it’s analyzing trades or monitoring the market, with colors and patterns that speak louder than words.
- Intuitive Design: The green and red gradients in analysis mode instantly convey bullish or bearish intent, while the blue-purple-green trio in monitoring mode feels like a friendly status update. It’s trading feedback made human.
- Dynamic Feedback: The sequential blinking in analysis mode and per-tick blinking in monitoring mode bring the EA to life, making it feel active and responsive rather than a silent black box.
- Chart-Friendly: At a modest 12-pixel size, the dots are noticeable but unobtrusive, ensuring your chart stays clean and focused on what matters most—price.
How It Fits Into Your Trading
Whether you’re a hands-on trader or letting LakshmiFX run the show, these animations bridge the gap between you and your EA. In Trade Analysis Mode, the flowing sequence of blinking dots mirrors the EA’s decision-making process, building anticipation for the next trade. In Monitoring Mode, the tick-by-tick blinking keeps you connected to the market’s rhythm, offering peace of mind that LakshmiFX is always on duty.
So, the next time you see those three dots dancing across your chart—whether in a green sweep, a red wave, or a blue-purple-green pulse—know that LakshmiFX is communicating with you. It’s more than just an EA; it’s a visual companion, turning complex algorithms into a simple, beautiful story you can follow with every blink.

